VisualLab is a powerful tool for probability and statistics anlysis of data. Descriptive
statistics and linear or nonlinear regression are simply a matter of click. When t-tests and
ANOVA tests are involved, however, it would be ideal to have some extra utilities to visualize
the processes how p-value is worked out from t-value or f-value through the t-distribution
probability density curve and f-distribution curve.
A t-test, also known as Student's t-test, is a test to determine if the difference between the
means of two groups is statistically significant, or to determine if the mean of a group is
statistically significant from a given value. It was developed by William Sealy Gosset under
the pseudonym Student. The probability density function of t-test is symmetric, and its
overall shape resembles the bell shape of a normally distributed variable with mean 0 and
variance 1. As the number of d.o.f. grows, t-distribution approaches the normal distribution
with μ = 0 and σ = 1.
A t-test can be a one sample test or two sample test (paired or unpaired). The above animation
shows if you want to visualize how p-value is worked out from t-value, you simply input the d.o.f.
value to display its corresponding t-distribution probability density curve. You then integrate
the area size under the t-curve over the t-value (or under the t-value if negative) to obtain
one tailed p-value. Two tailed p-value is the double of one tailed p-value, representating
the area size of two tails on the both sides of the t-distribution curve.
ANOVA (analysis of variance):
ANOVA (analysis of variance) is a technique in statistics developed by tatistician Ronald
Fisher. It is used to analyse the variation among and between groups to check if the means of
two or more groups are significantly different from each other. Several screen shots are shown below
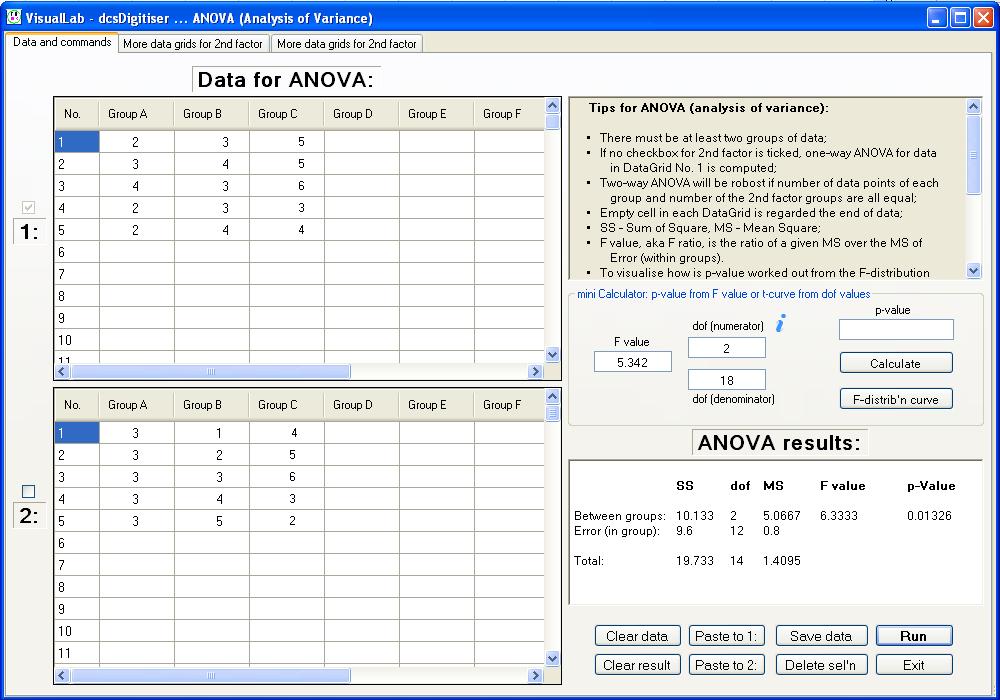
One way ANOVA: Screen shot for one way ANOVA, click the button "Run".
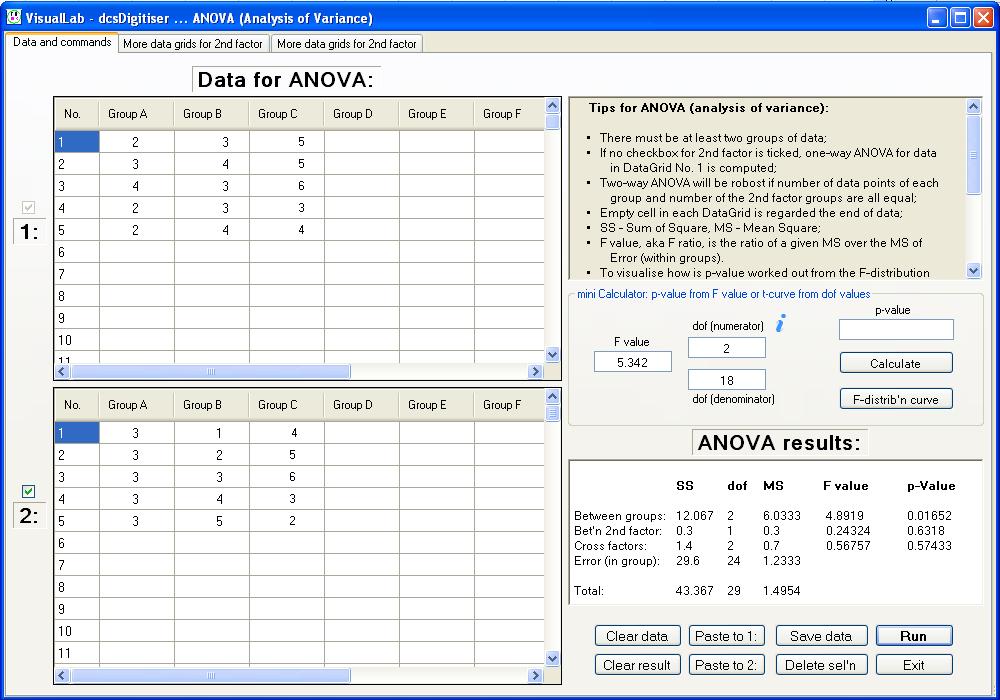
Two way ANOVA: Screen shot for two way ANOVA, check the factor box "2" and click the button
"Run".
From F-value to p-value:
F-value is the ratio of between-group variability over within-group variability, a.k.a. the
ratio of explained variance over unexplained variance. There is a mini calculator to allow one
to compute p-value from F-value and d.o.f between groups and d.o.f. within groups.
An F-test is a statistical test in which the test statistic has an F-distribution under the
null hypothesis. The name was in honour of Ronald Fisher who initially developed the statistic
as the variance ratio around a century ago.
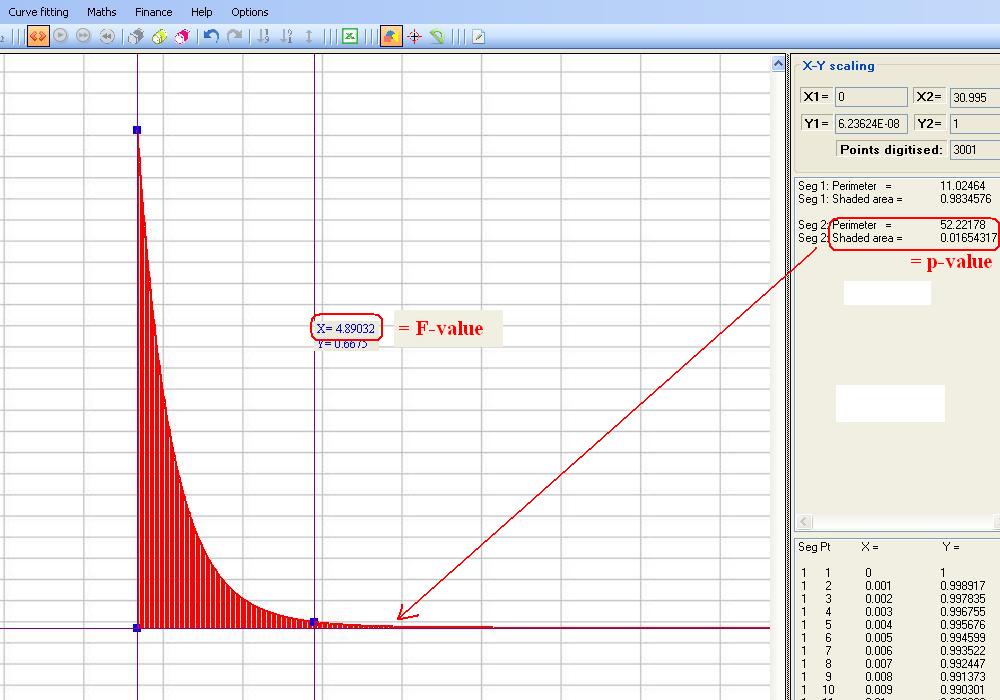
The F-distribution probability density function, or F-curve in short is needed to compute
p-value from F-value. Type the value of d.o.f. into the box, and click the button "F-distribution
curve", you'll see the corresponding F curve displaying on screen. You then integrate
the area size under the F-curve over the F-value to obtain the p-value. Unlike a t-test, there
is no "two tailed" p-value in an F-test.
F-distribution probability density function: Screen shot for the F-curve, F-value and p-value.
Normal distribution and Binomial distribution
Normal distribution:
Normal distribution (a.k.a. Gaussian or Gauss or Laplace - Gauss distribution) is a type of
continuous probability density distribution for a real-valued random variable. The general
form of its probability density function is:
where, parameter μ is the mean or expectation of the distribution; and σ is its
standard deviation. Variance of the distribution is σ2. A random variable with
a Gaussian distribution is said to be normally distributed and is called a normal deviate.
The normal distribution is the most important probability distribution in statistics.
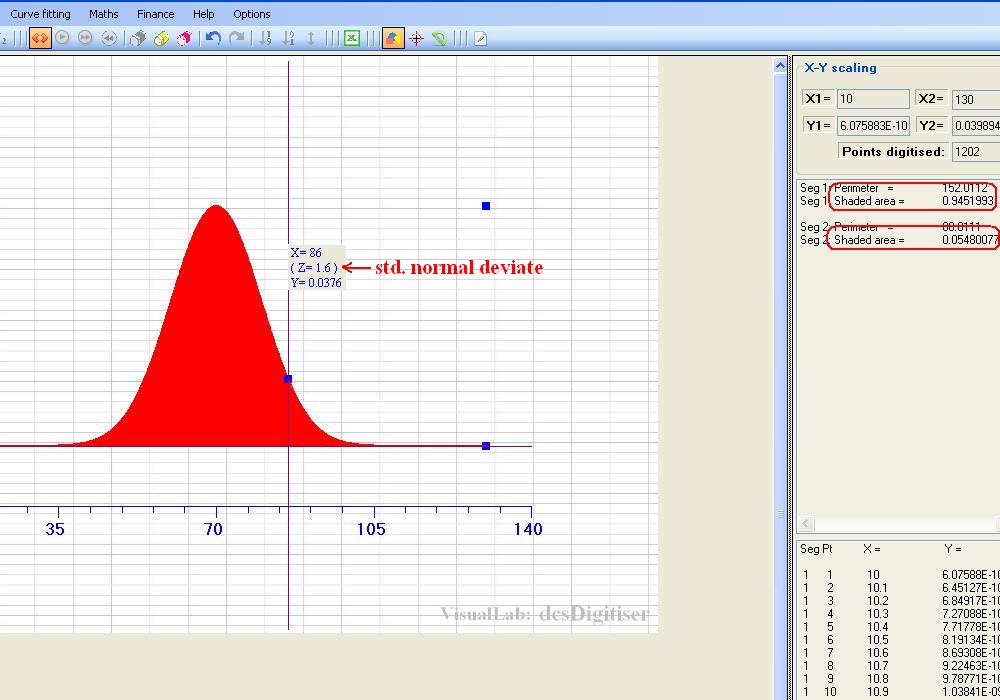
Normal probability: Screen shot for a normal probability distribution, where assuming
students' average score mark is μ = 70, with standard deviation σ = 10. The screen
shot shows 5.48% students having score mark higher than 86 (standard normal deviate = 1.6),
94.5% students below.
Binomial distribution:
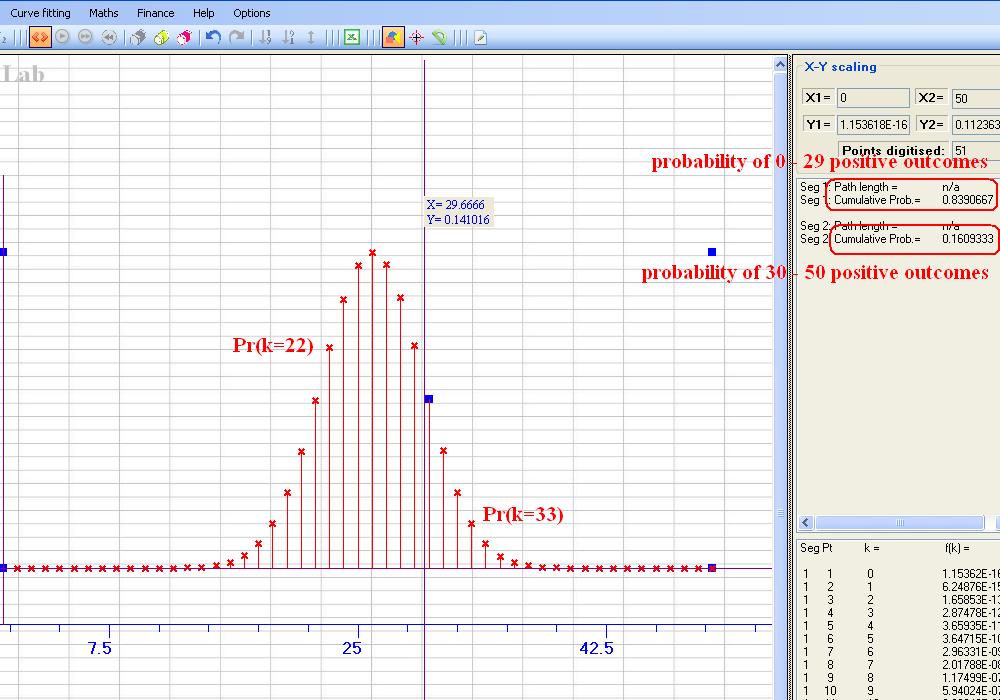
Binomial distribution is a discrete probability distribution. The outcome of a trial is always binary: yes or no; positive or negative, true or false. If the probability for one outcome is described as p, the probability for the other outcome would be q = 1 - p. The binomial distribution function shows that for a sequence of n independent trials (a.k.a. Bernoulli trial or Bernoulli experiment), the probability that k trials turn out positive outcome, Pr(k). The binomial distribution is the basis for the popular binomial test of statistical significance.
Binomial probability: Screen shot for a binomial probability distribution, where n
= 50, and p = 0.52.
To visit DSC Curve Solutions (DCS ®) and non-isothemal kinetics, click links shown in naviation bar.